
Claude in Excel, Word and PowerPoint: Eight Prompts That Save You Hours of Formulas, Reports and Slides Every Week
The Excel formula you hunt for half an hour, the Word report you cannot start, the deck you build the night before. Eight ready prompts that make Claude build, explain or organise the file, plus a way to verify the result.
 Mulk Allah Al-Sadi7 min read

What you will get
By the end of this guide you will have eight ready prompts for the most repetitive office tasks: building and explaining formulas, cleaning data, analysing it with charts, designing a pivot table, restructuring a report, writing meeting minutes and producing a full deck, plus a simple verification habit that protects you from errors.
Most office time does not go into thinking but into mechanical work: remembering a formula, unifying date formats, turning scattered notes into a report, turning a report into slides. These are exactly the tasks Claude handles well when you give it clear context.
What can Claude do with files today?
According to the Claude Help Center, Claude can run code to create and edit Excel (.xlsx), Word (.docx), PowerPoint (.pptx) and PDF files in the conversation, including spreadsheets with working formulas and charts, which you can download or save to Google Drive. It is available on all plans including Free, can be turned on in Settings under Capabilities, and the file size limit is 30 MB for uploads and downloads.
According to the pricing page, the Claude add-ins inside Microsoft 365 apps such as Excel, Word and PowerPoint are on paid plans. Every prompt below also works in a normal chat: upload the file or paste part of it, and get back the new file, formula or text.
One rule before you start: do not upload confidential or personal data from your clients or employer without permission. Use a sample or anonymised data when needed.
The eight prompts
You are an Excel expert. My table columns:
[A: date, B: employee name, C: department, D: amount ...]
Data runs from row 2 to [last row]. Version: [Excel 365 / 2019 / Google Sheets].

I need a formula in [cell] that calculates: [precise description, e.g. the sum of amounts for Sales in the month given in F1].

Give me:
1. The formula, ready to paste.
2. A one-line explanation of each part.
3. An alternative for older versions if it relies on newer functions.
4. 3 small test cases with dummy values and the expected result for each.
5. Likely errors (blank cells, text instead of numbers) and how to handle them.
When to use it: When you know what to calculate but not the formula.
What to expect: A paste-ready formula, a one-line explanation per part, an alternative for older Excel versions, and test cases you can check by hand.
Explain this formula as if I only know Excel basics:
[paste formula]

Context: [what it should calculate and which columns it references]

1. What it does overall, in one sentence.
2. Break it down from the inside out, step by step.
3. A numeric example showing how it reaches the result.
4. Any risks (wrong absolute references, ranges that do not expand, errors hidden by IFERROR)?
5. Suggest a simpler or clearer version if one exists, and explain the difference.
When to use it: When you inherit a file with formulas you do not understand.
What to expect: A plain-language step-by-step breakdown, a worked numeric example, weak spots in the formula and a simpler version where possible.
I attached [file name] (or here is a 20-row sample: [paste]).
Purpose of the data: [e.g. a monthly sales report].

1. Inspect the data and list every issue: duplicates, missing values, inconsistent date and number formats, extra spaces, names written several ways, outliers.
2. Propose an ordered cleaning plan and the decision you need from me for each ambiguous case.
3. Do not delete any row before telling me why and how many.
4. After I approve: create a cleaned file plus a "Change log" sheet documenting every edit.
When to use it: Before any analysis of imported data or data combined from several sources.
What to expect: A list of detected data issues, an ordered cleaning plan, and, if you upload the file with file creation on, a cleaned file with a log of every change.
I attached data about [description]. Audience: [department head / sales team].
The decision this analysis should support: [...]

1. Suggest 5 useful analysis questions for this decision, then wait for my choice.
2. After I choose: compute the results and create a suitable chart for each question, explaining the chart type.
3. Write 3-5 conclusions and mark each one: proven by the data, or a possible explanation that needs checking?
4. State the data's limits (short period, small sample, missing data).
5. Put it all in an Excel file with a data sheet and a summary-and-charts sheet.
When to use it: When you need to understand what the data says and present it to your manager.
What to expect: Suggested analysis questions first, then numbers and charts with interpretation, clearly separating what the data proves from what is only plausible.
My data columns: [...]. The report I need every [week/month]: [description].

1. Design one or more pivot tables: which fields go in rows, columns, values and filters, and the aggregation (sum, average, count).
2. Write the steps to build it in Excel, in order.
3. Suggest how to make the data update automatically (convert to a Table, dynamic range).
4. Suggest a summary dashboard with 3-4 KPIs and two charts.
5. If I upload the file: create a copy with this design built in.
When to use it: When you want a recurring report that updates itself every month.
What to expect: A clear field design (rows, columns, values, filters) with manual steps to build it, or a ready file if you ask.
I attached a draft/notes for a report on [topic]. Reader: [senior management / a client / a professor].
Goal of the report: [persuade toward a decision / document / present results].

1. Propose a heading structure before writing and wait for my approval.
2. After approval: write a 5-line executive summary at the top, then the sections.
3. Keep all information and numbers as they are, and add nothing of your own.
4. End with a list: "Missing information I need from you".
5. Create a Word file with formal formatting: heading levels, tables where useful, page numbers.
When to use it: When you have a long draft or scattered notes and need a formal report.
What to expect: A proposed structure for approval first, then an organised report with headings and an executive summary, plus a list of missing information instead of filler.
These are my raw notes from a meeting on [topic] on [date]. Attendees: [...]:
[paste notes]

Create:
1. A 3-line summary.
2. Decisions made.
3. A task table: task | owner | due date. If the owner or date was not stated, write "not set" and do not guess.
4. Open questions that need follow-up.
5. A short professional email to the attendees summarising all of this.
When to use it: After any meeting, within minutes of it ending.
What to expect: Short minutes with decisions and tasks with an owner and due date, open questions and a ready follow-up email, marking anything without a named owner.
I attached [report/document]. I will present it to [audience] in [length] minutes.
The key message I want them to leave with: [...]

1. Propose an outline of [number] slides: each with an action title (a sentence stating the takeaway, not just a topic), at most 3 bullets, and a suggested chart or image.
2. Wait for my approval of the outline.
3. Then create a PowerPoint file with a simple, consistent design and speaker notes on every slide.
4. Use numbers from the document only, and add a final slide with the next steps required.
When to use it: When you have a report and need a presentation from it fast.
What to expect: A slide outline where each title carries the message, speaker notes, then a downloadable, editable deck file.
The verification habit: never deliver without it
Claude sometimes makes mistakes, especially with cell ranges and numbers. Before sending any file, test the formula on rows whose answer you know, check at least one total by hand, and read the whole report yourself.
- "Review the file you created: do any formulas reference wrong ranges or blank cells?"
- "Give me three numbers from the summary and how to verify each by hand."
- "Make the report 30% shorter without removing any number or decision."
- "Turn this analysis into a 120-word email to my manager."
Common mistakes
- Describing the table vaguely; always give column names, row range and version.
- Uploading confidential data without your employer’s permission.
- Treating conclusions as facts without separating what the data proves from interpretation.
- Asking for the deck directly without approving the outline first.
- Copying a formula without testing it on known cases.
Quick workflow checklist
- Turn on file creation and editing in Claude’s settings.
- Clean the data first (3), then analyse (4) and design the summary (5).
- For formulas: build (1) or explain (2), then test.
- Turn notes into a report (6) or minutes (7).
- Turn the report into a deck (8) after approving the outline.
- Apply the verification habit before sending.
More articles

Stop Collecting Resource Lists: A 4-Week Roadmap to Learn AI Agents from Free Official Sources, Plus Eight Prompts to Build Your First Agent
“Top 50 resources” lists about AI agents get saved and never read. This guide picks just four free official sources, orders them into a four-week plan that ends with a small working agent, and gives you eight ready-to-copy prompts.
Mulk Allah Al-Sadi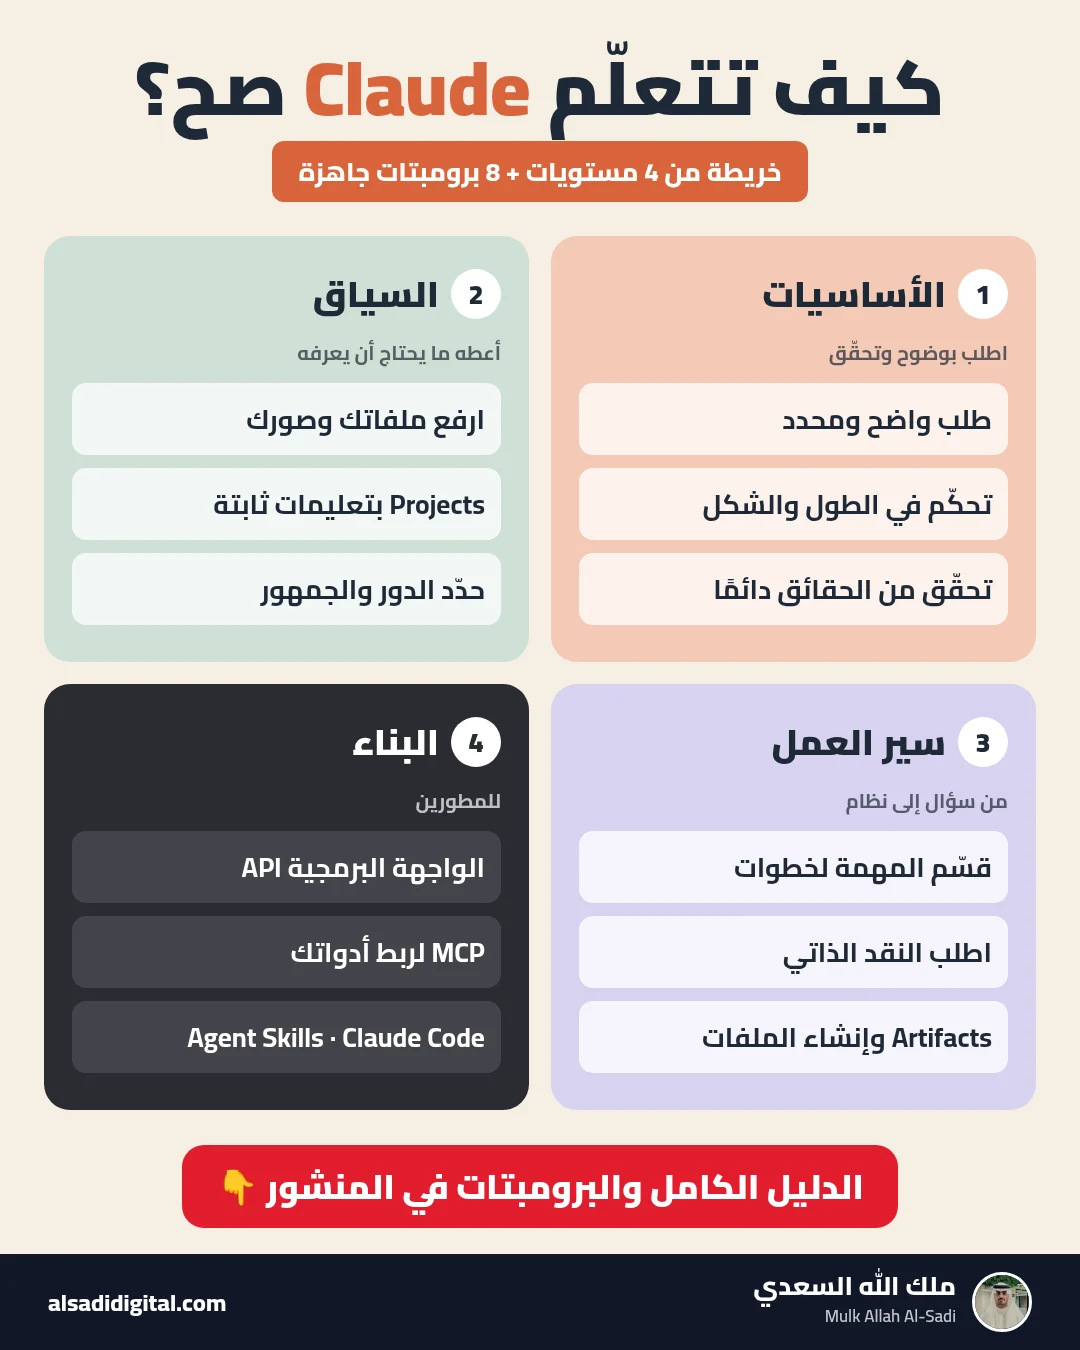
Learn Claude the Right Way: A Four-Level Map and Eight Prompts That Turn It into a Team of Experts
Skip the random experiments: a clear map of what to learn at each level of Claude, plus eight copy-ready prompts that make it work as your researcher, analyst, advisor, critic and tutor.
Mulk Allah Al-Sadi
Start Data Analytics from Zero: Cisco’s Free Data Analytics Essentials Course and Eight Prompts That Make AI Your Personal Coach
A practical guide to completing Cisco’s free data analytics course (Excel, SQL and Tableau) with real understanding, plus eight prompts for studying, practising, publishing a GitHub project and preparing for interviews.
Mulk Allah Al-Sadi