
Start Data Analytics from Zero: Cisco’s Free Data Analytics Essentials Course and Eight Prompts That Make AI Your Personal Coach
A practical guide to completing Cisco’s free data analytics course (Excel, SQL and Tableau) with real understanding, plus eight prompts for studying, practising, publishing a GitHub project and preparing for interviews.
 Mulk Allah Al-Sadi7 min read
What you will get
By the end of this guide you will have a plan to finish the course, an AI coach that explains Excel, SQL and Tableau without doing the work for you, and a published analytics project with a professional README for your CV.
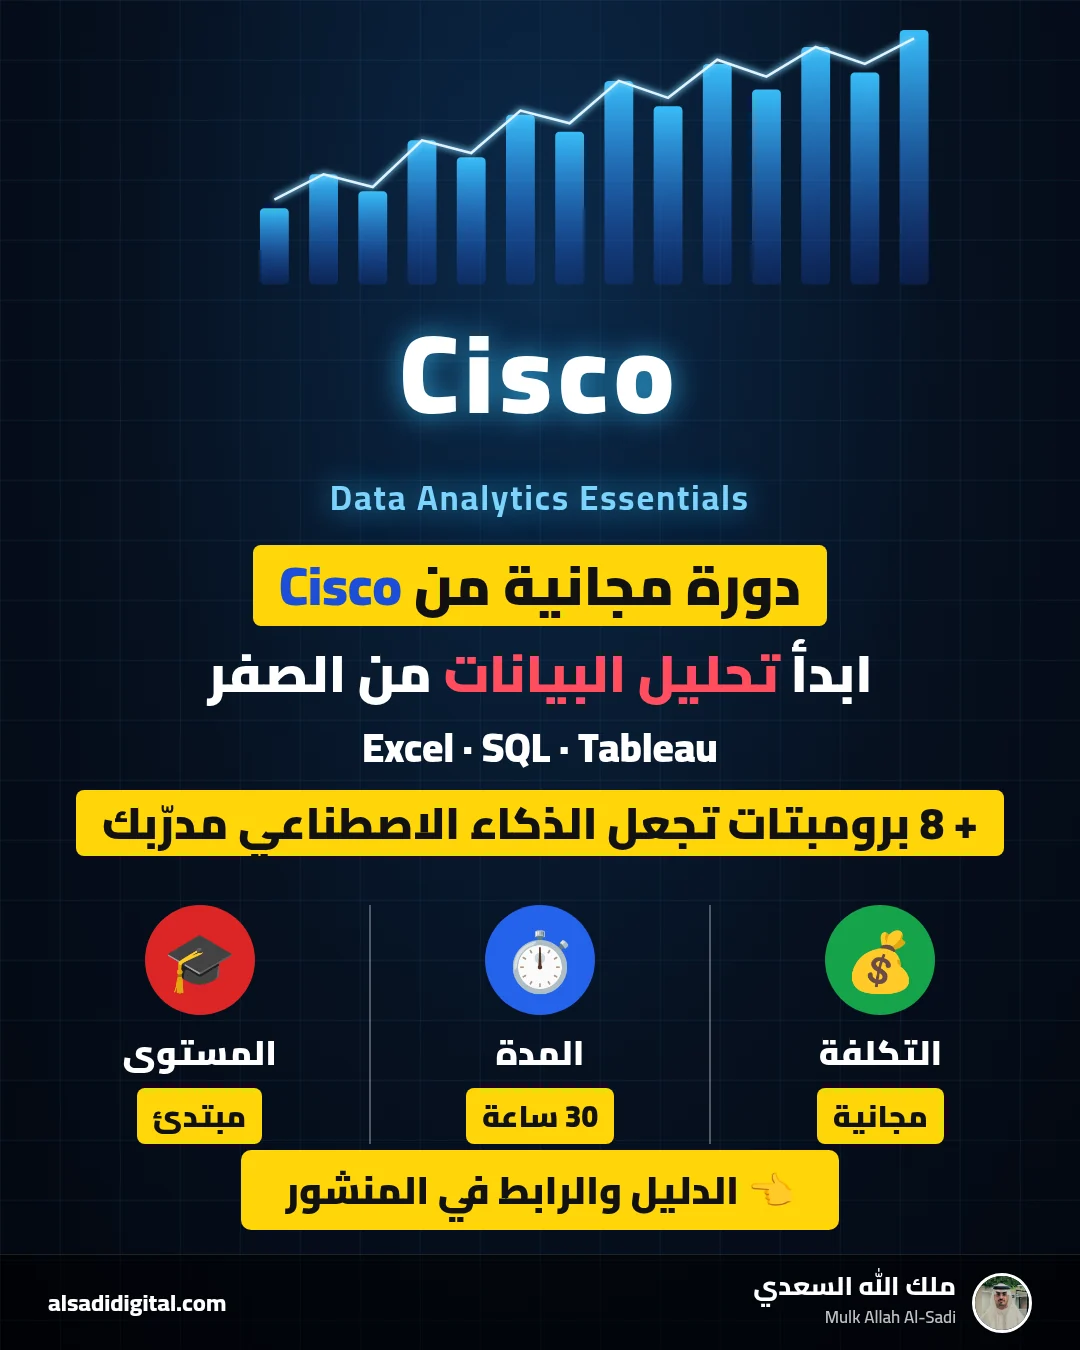
One of the best free starting points in data analytics today is Data Analytics Essentials from Cisco Networking Academy at netacad.com. According to its official page, it is free, self-paced and beginner level, estimated at 30 hours with 29 hands-on labs, and available in several languages including Arabic. It covers transforming, organising and visualising data in Excel, querying relational databases with SQL, building dashboards in Tableau, plus data ethics and bias, and ends with a portfolio including an analysis of a popular movies dataset.
On completion you can earn a Cisco digital badge; its Credly page lists a 70% passing score on the comprehensive exam as the requirement. But the badge is not the goal; the goal is being able to analyse real data. That is where Claude or ChatGPT come in, as a coach that explains, tests and reviews, not a tool that solves exercises for you.
A golden rule before the prompts
Ask AI for explanations, hints and reviews, never ready-made answers to course labs or exam questions. The first builds skill; the second gets you a badge without ability and may break the platform’s integrity rules.
The eight prompts
I am a data analytics beginner enrolled in Cisco Data Analytics Essentials (estimated 30 hours, covering Excel, then SQL, then Tableau and a final project).

My time: [number] hours per week, and I want to finish in [number] weeks.
My background: [e.g. basic Excel, no SQL].

Create a weekly plan as a table: week | modules | hours | extra exercise outside the course | how I know I have mastered it.
Add a review day every two weeks and suggest a mini project after finishing each tool (Excel, SQL, Tableau).
If the timeline is unrealistic for my time, say so and suggest a better one.
When to use it: On day one, before module one.
What to expect: A weekly table spreading the ten modules over your time, with review days and a mini project after each tool. Adjust if your pace differs.
You are a patient Excel coach. Do not give me the final answer to the exercise.

What I am trying to do: [describe the task, e.g. extract the year from a date column and average the rating per year]
My columns: [column names and type of each]
What I tried: [the formula or step and the error]

Deliver:
1. The logic step by step in words.
2. Which functions or tools fit (e.g. XLOOKUP, SUMIFS, PivotTable) and why.
3. A worked example on small, different data you create.
4. A similar challenge for me to solve; then correct my answer when I send it.
When to use it: When you are stuck on a function or task in an Excel lab.
What to expect: The logic and the right functions, an example on different data than the lab’s, then a small challenge for you to solve.
You are a data analyst specialising in data quality.

Dataset: [description]
Columns: [name: type: example value] for each column
Approximate rows: [number]
Analysis goal: [the question I want to answer]

Create an ordered cleaning checklist:
1. The check (missing values, duplicates, mixed date formats, extra spaces, outliers, inconsistent categories).
2. Which columns specifically.
3. How to detect it in Excel (function or tool).
4. How to fix it, and when deleting would be a mistake.
5. What to record in my cleaning log.

Remind me to keep an untouched original copy.
When to use it: Before analysing any dataset, in the course or your own project.
What to expect: An ordered checklist tailored to your columns (missing values, duplicates, formats, outliers) with how to run each check in Excel.
You are a SQL coach. Explain; do not shortcut.

Schema:
[table (columns)] for each table, and relationships: [e.g. movies.id = ratings.movie_id]

The question: [e.g. top 10 highest-rated films after 2010 with more than 1000 ratings]
My current query (if any):
[paste]
Error message: [if any]

Deliver:
1. Turn the question into logical steps (which table, filter, grouping, ordering).
2. Build the query gradually, explaining each part (SELECT, JOIN, WHERE, GROUP BY, HAVING, ORDER BY).
3. If I have an error: its exact cause and how to avoid it.
4. A slightly harder follow-up question to practise.
When to use it: While learning SQL, or when a query fails and you do not know why.
What to expect: The question broken into steps, the query built piece by piece with explanations, and a clear reading of any error message.
This is the schema I practise on:
[tables, columns and relationships]

Create 10 graded SQL exercises:
- 1-3: SELECT, WHERE, ORDER BY.
- 4-6: GROUP BY, aggregates, HAVING.
- 7-8: JOINs across two or more tables.
- 9-10: subqueries or window functions.

For each: a practical business question (not SQL wording) and a difficulty level.
Do not write the solutions. I will send my query for each; correct it, explain any mistake and suggest a cleaner version.
When to use it: After the SQL modules, to lock in the skill on a schema you know.
What to expect: Ten graded exercises with solutions hidden until you ask, then corrections of your queries with explanations.
You are a dashboard designer skilled in data storytelling.

Data: [column descriptions]
Audience: [who uses it and what decision they make]
Core message: [...]

Design the dashboard on paper:
1. 3-5 questions the dashboard answers.
2. For each: the right chart type, why it beats alternatives, and the fields used.
3. Layout order (most to least important) and interactive filters.
4. A title for each chart that states the insight, not the variable name.
5. Five common design mistakes to avoid in this specific dashboard.
When to use it: Before building the dashboard in the Tableau module or your project.
What to expect: The dashboard’s questions, the right chart for each and why, the layout and filters, plus design mistakes to avoid.
Write a professional README.md for a data analytics project on GitHub, using only this information:

- Project title: [...]
- Analytical question: [...]
- Data source and size: [...]
- Cleaning steps I did: [...]
- Tools: [Excel / SQL / Tableau]
- Top 3 findings (with the numbers I found): [...]
- Tableau Public link, if any: [...]
- Limitations: [...]

Sections: Overview, Question, Data, Method, Key findings, How to reproduce, Limitations and next steps.
Write clearly for a recruiter with two minutes, and add no finding I did not provide.
When to use it: After finishing the final project or any analysis, before publishing it.
What to expect: A structured README: question, data, method, findings, tools and limitations, written only from your information and suited to recruiters.
Act as a recruiter for a [junior data analyst / intern] role.

My skills: Excel, basic SQL, Tableau, and an analysis project on [topic].

Run a mock interview:
- One question per message; wait for my answer.
- Mix: a behavioural question, a practical SQL question, a chart-choice question, a question about my project, and one about handling messy data.
- After each answer: a score out of 5, what was good, and how to make it stronger.
- After 8 questions: a summary of my strengths and what to improve before the real interview.
When to use it: After the course and project, before applying for an internship or job.
What to expect: An interactive interview, one question at a time, covering Excel, SQL, visualisation and your project, with a score and improvement tips per answer.
Tips to get more out of it
- After each module, apply what you learned to a different public dataset.
- Log your SQL errors and their messages; it becomes your best reference.
- Publish dashboards on Tableau Public and link them from your GitHub project.
- A useful follow-up: "Explain my mistake as if teaching another student, then give me an exercise that tests exactly this point."
Common mistakes
- Copying lab solutions from AI, then struggling in the final exam or the first real task.
- Relying on outdated course details from unofficial sources; always check the course page on netacad.com.
- Uploading confidential real data to AI tools; use column descriptions or a dummy sample.
- Stopping at the badge without a published project that proves the skill.
Quick workflow checklist
- Enrol on netacad.com and pick your language.
- Get a plan that fits your time (prompt 1).
- Excel: function coach (2) and cleaning checklist (3).
- SQL: query coach (4), then exercises (5).
- Tableau: plan the dashboard on paper first (6).
- Publish the project with a README (7), then practise the interview (8).
More articles

Stop Collecting Resource Lists: A 4-Week Roadmap to Learn AI Agents from Free Official Sources, Plus Eight Prompts to Build Your First Agent
“Top 50 resources” lists about AI agents get saved and never read. This guide picks just four free official sources, orders them into a four-week plan that ends with a small working agent, and gives you eight ready-to-copy prompts.
Mulk Allah Al-Sadi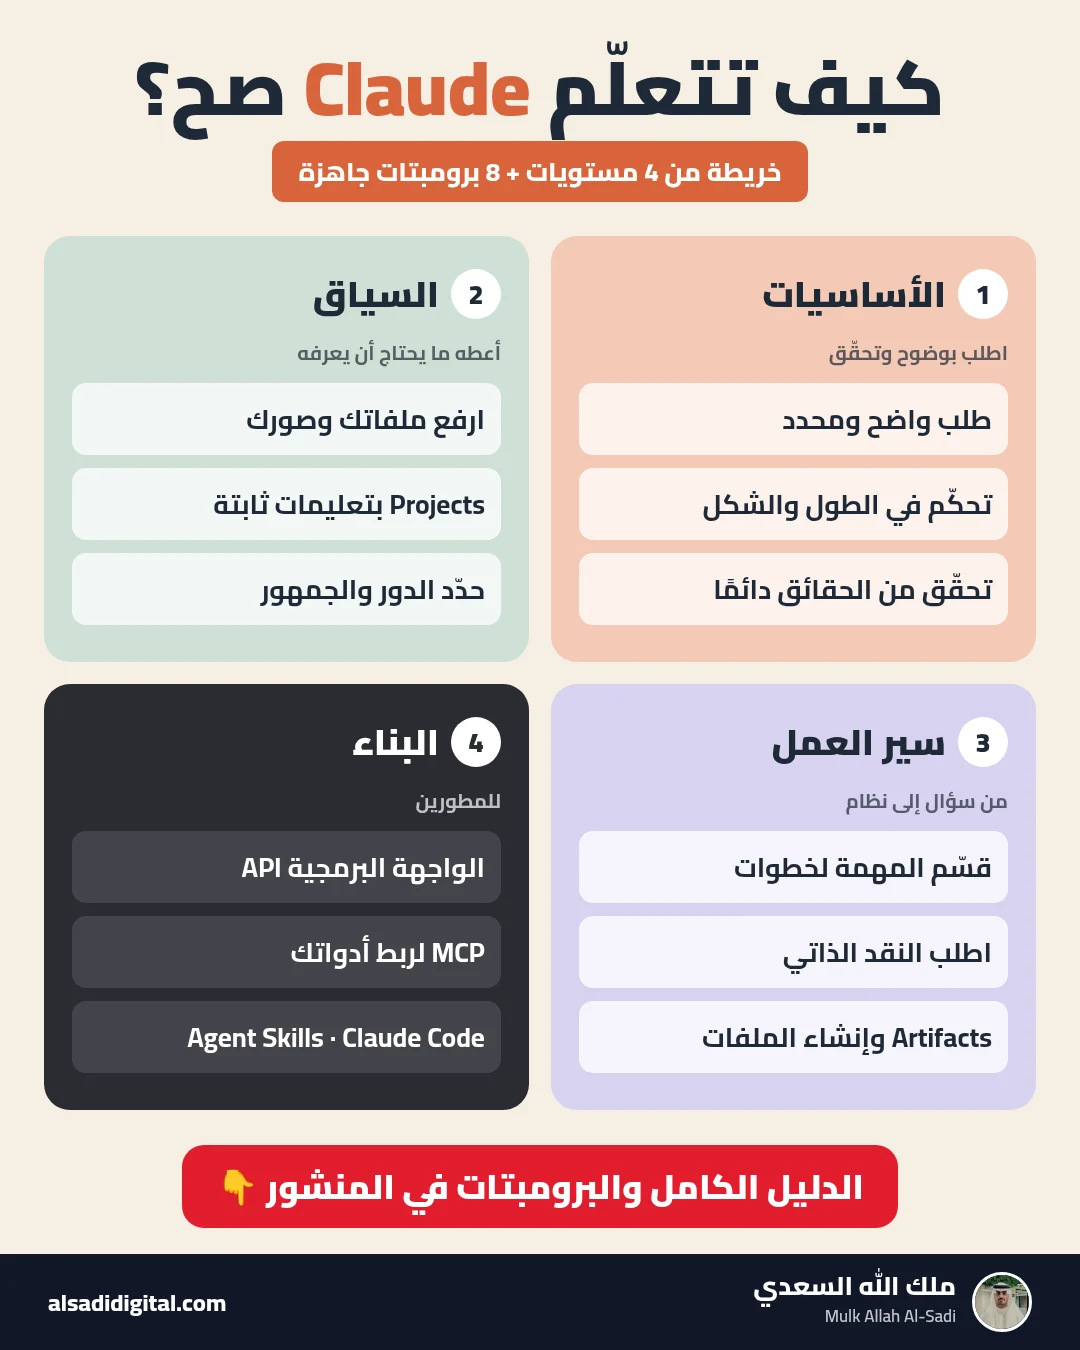
Learn Claude the Right Way: A Four-Level Map and Eight Prompts That Turn It into a Team of Experts
Skip the random experiments: a clear map of what to learn at each level of Claude, plus eight copy-ready prompts that make it work as your researcher, analyst, advisor, critic and tutor.
Mulk Allah Al-Sadi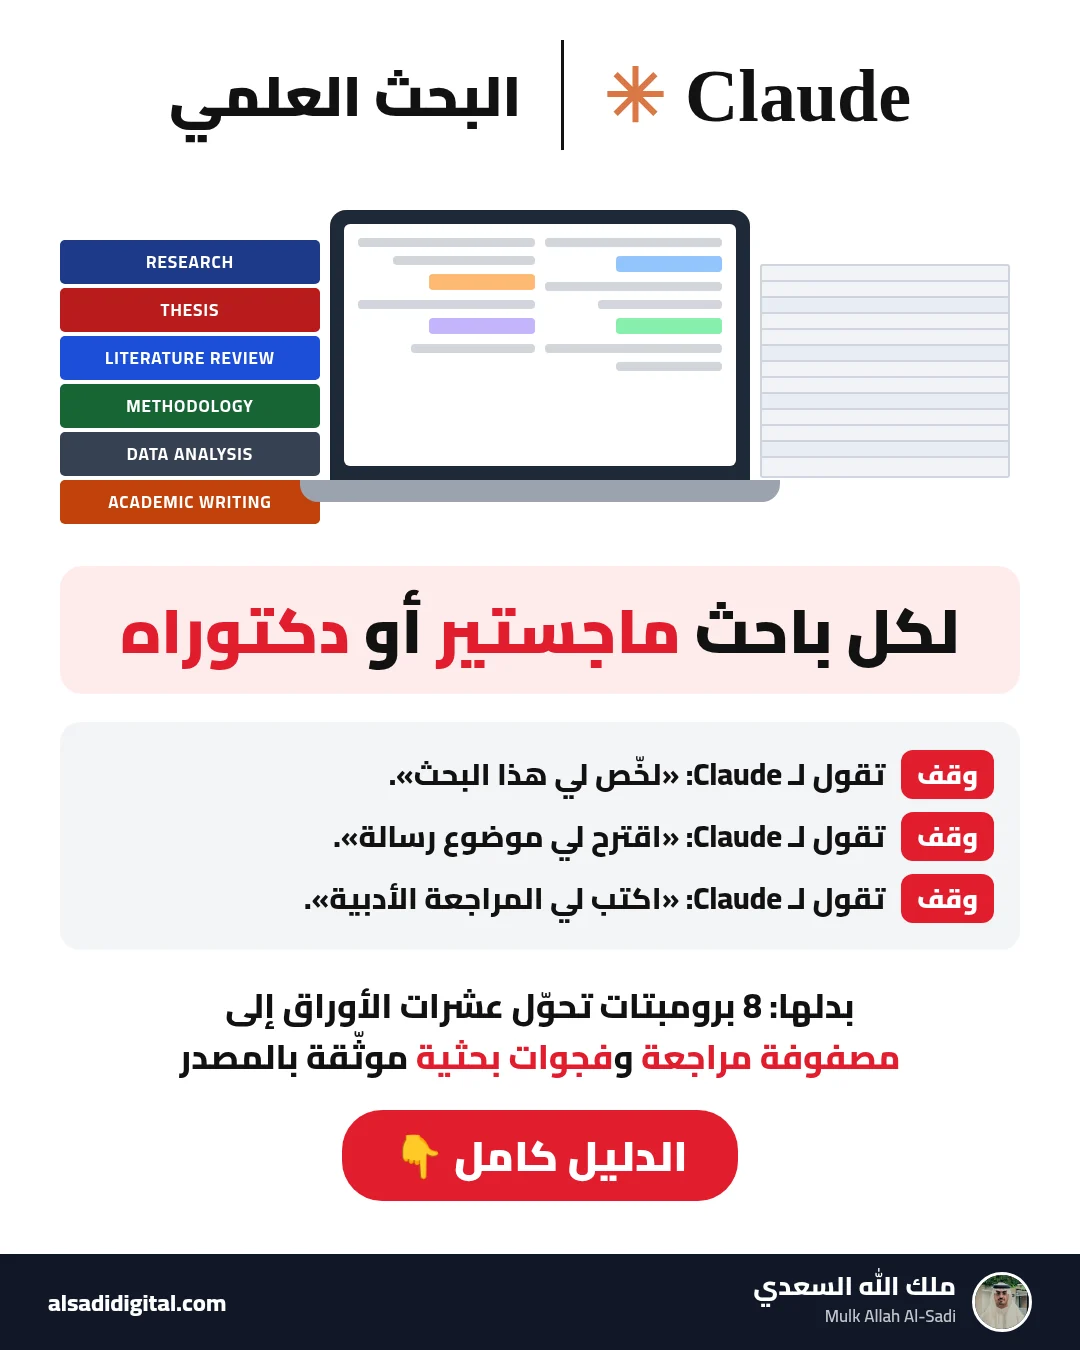
Claude for Academic Research: Eight Prompts That Turn Dozens of Papers into a Review Matrix and Clear Research Gaps
A complete research workflow with Claude: building a search strategy, dissecting each paper, building the literature matrix, finding gaps and critiquing methods, with eight precise prompts that prevent fabrication.
Mulk Allah Al-Sadi